
Talking About the Stock Market (4) - How to Read BBI?
1. Moving averages: magic, or "retail indicator"?
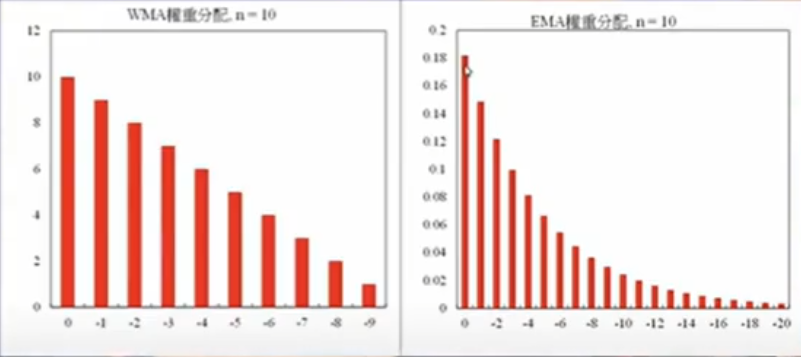
Moving averages are not that mystical. They mostly come in three types: SMA, WMA, EMA. All are averages; they differ in weighting.
Plain-language:
- SMA is "equal weight": SMA5 averages the last 5 closes equally.
- Markets care more about recent information, so WMA and EMA weight recent prices more.
- WMA uses linear decay
- EMA uses exponential decay (faster decay)
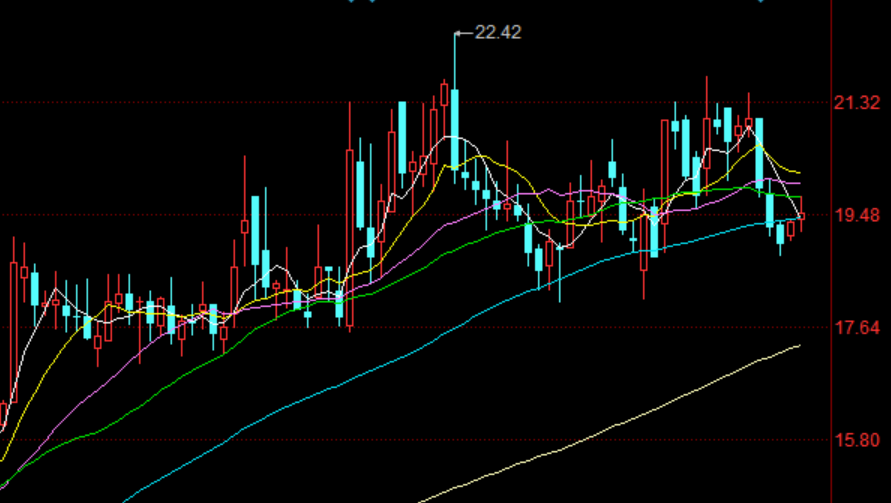
The colorful 5/20/60-day lines on charts can overwhelm beginners. I once displayed eight moving averages at once:
BBI can make the chart cleaner.
2. What is BBI, and why is it "lazy-friendly"?
BBI stands for Bull and Bear Index. It is basically an "average of moving averages": take 4 SMA lines with different windows and average them.
Many apps default to SMA3, SMA6, SMA12, SMA24:
(SMA3 + SMA6 + SMA12 + SMA24) ÷ 4
You can usually add it easily as a main-chart overlay (often shown as a yellow line):
3. How to Use BBI in Practice
BBI is not decorative. It gives two simple functions:
- Determine market regime (bull, bear, range)
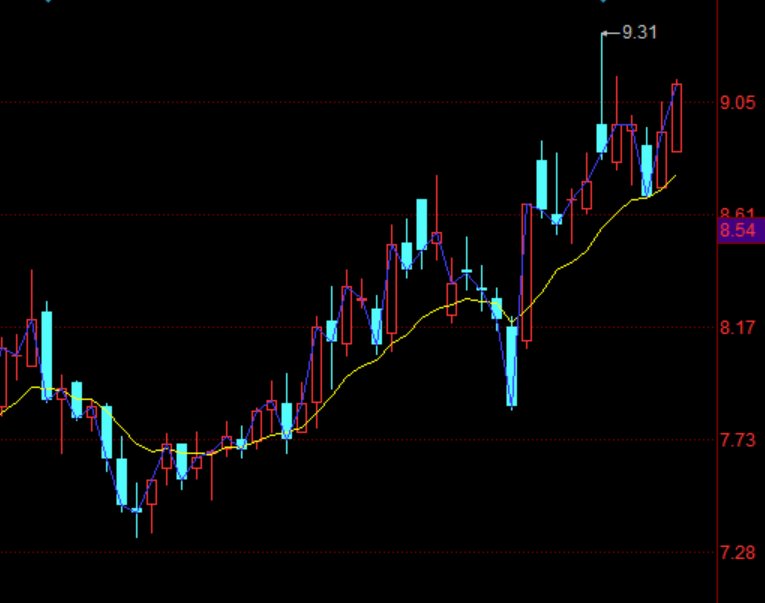
- Price staying above BBI: bull regime (example: Lead Intelligent in Sep)
 BBI bull example
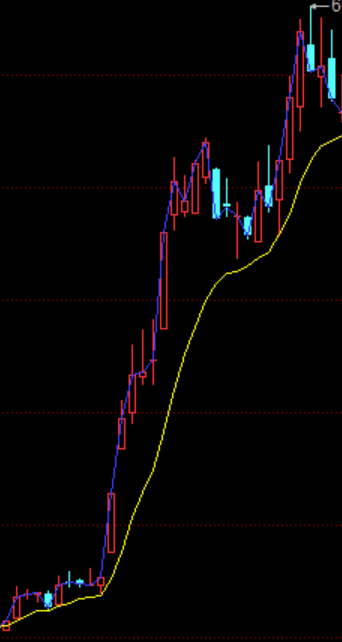
 - Price staying below BBI: bear regime
- Price crossing BBI up and down: range regime (watch out for long consolidation)
- Find support and resistance
- In bull regimes: pullbacks to BBI often act as support; consider small buys.
- In bear regimes: rebounds to BBI often act as resistance; consider reducing.
4. How to Add BBI in Tonghuashun
Tonghuashun PC: Tools → Formula Management → New → Technical Indicator → find the built-in "BBI" function, and set drawing mode to "Main chart". Then you can select it in the chart overlay options.
In the end, both moving averages and BBI are probability tools, not guaranteed money machines. Do not worship a single line, but do not dismiss them as "retail-only" either. Used well, they provide another lens to observe price behavior.