Talking About the Stock Market (2) - Can RSI Actually Help You Make Money?
1. Technical Analysis Isn't Mysticism, and RSI Isn't Magic
Many people dismiss technical analysis, especially value investors, and claim indicator users are "leeks". But personally, I find indicators useful in trading—they do have math/statistics logic behind them. In the end, trading is a probability game.
With the same RSI, some people profit and some people lose. The key is not the indicator, but usage. Some people force one indicator in all regimes (trend and range). Others learn too many indicators and get lost. Indicators have different roles: some fit trends, some fit ranges.
RSI is not ideal for strong trending names. It is more suitable for short-term guidance, especially in ranging markets.
2. How Is RSI Calculated?
Step 1: Compute RS (relative strength)
RS = average gain over the past N days ÷ average loss over the past N days.
Two key statistical ideas:
- Only count days with actual gains/losses; flat days are ignored.
- Use averages to smooth noise and reduce the impact of single-day outliers.
Step 2: Convert RS into a 0–100 scale
RSI = 100 - [100 ÷ (1 + RS)]
This is a normalization step. RS can be very large or very small; mapping to 0–100 makes interpretation intuitive:
- RS → ∞ (only gains): RSI → 100 (extremely strong)
- RS = 0 (only losses): RSI = 0 (extremely weak)
- RS = 1: RSI = 50 (balanced)
3. What RSI Really Means, and How to Choose Periods
RSI (Relative Strength Index) compares buying and selling strength over a window. Higher RSI implies stronger buying pressure, lower RSI implies stronger selling pressure, around 50 implies balance.
Most apps show RSI(6), RSI(12), RSI(24): different windows, like daily/weekly/monthly charts.
- shorter window (6): more sensitive, more signals
- longer window (24): slower, fewer signals
Choosing 6/12/24 is mostly convention. You can use 5/10/20 too.
One reminder: tweaking periods does not magically improve accuracy. I usually keep a single RSI line (6 or 12). I do not recommend beginners overcomplicate with multiple lines and crossovers.
4. Practical Usage
Two main RSI uses:
- basic: overbought/oversold
- advanced: divergence
Combined with Bollinger Bands, signals can be stronger.
1) Basic: overbought/oversold
Core idea: after large moves, prices tend to mean-revert.
- Conservative thresholds: 80 (overbought) and 20 (oversold)
- Aggressive: 70 and 30 (more signals)
Personally, I use 80/20.
- RSI > 80: buying pressure overheated; risk of pullback rises
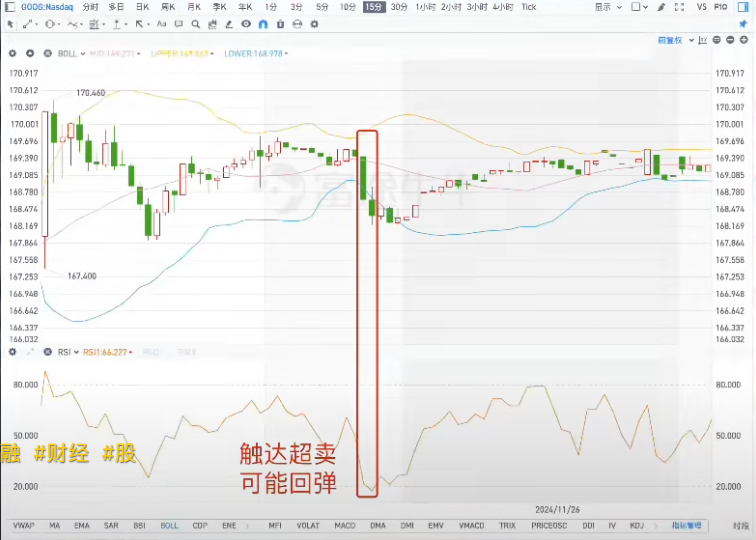
- RSI < 20: selling pressure extreme; rebound probability increases
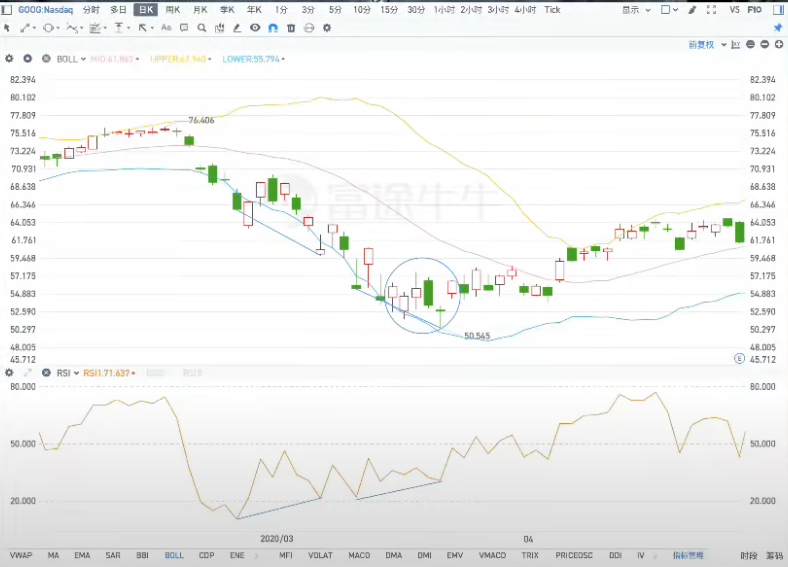
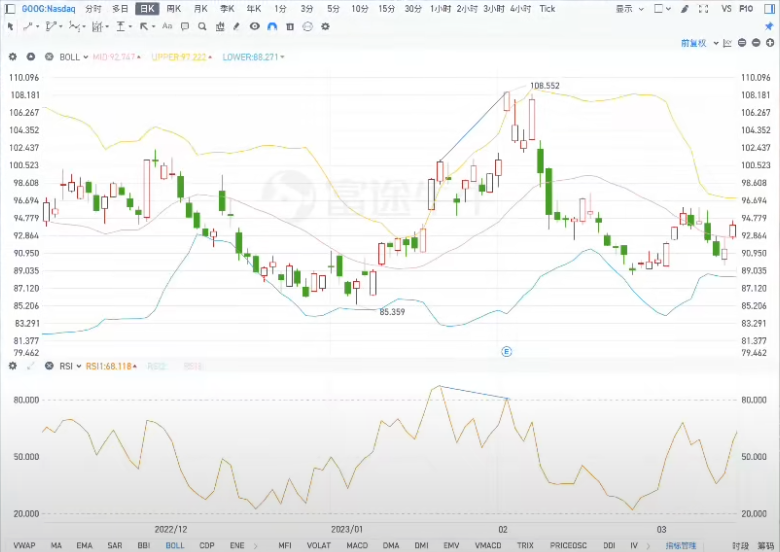
Example: Google intraday oversold rebound:
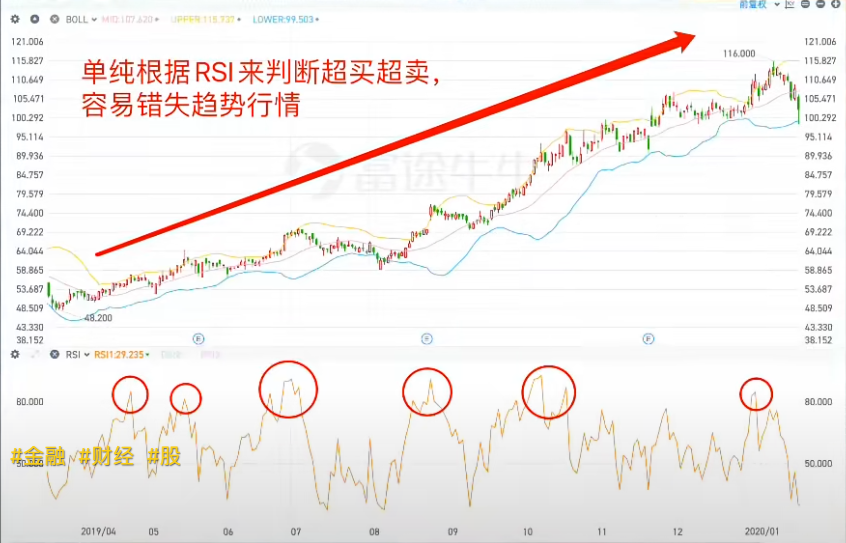
Key point: RSI is not great in strong trends. In sustained uptrends, RSI repeatedly flags overbought; selling on that can make you miss big gains.
For trend names, RSI can be misleading:
2) Advanced: RSI divergence
Normally, price up → RSI up, price down → RSI down. Divergence (opposite direction) can hint at a reversal.
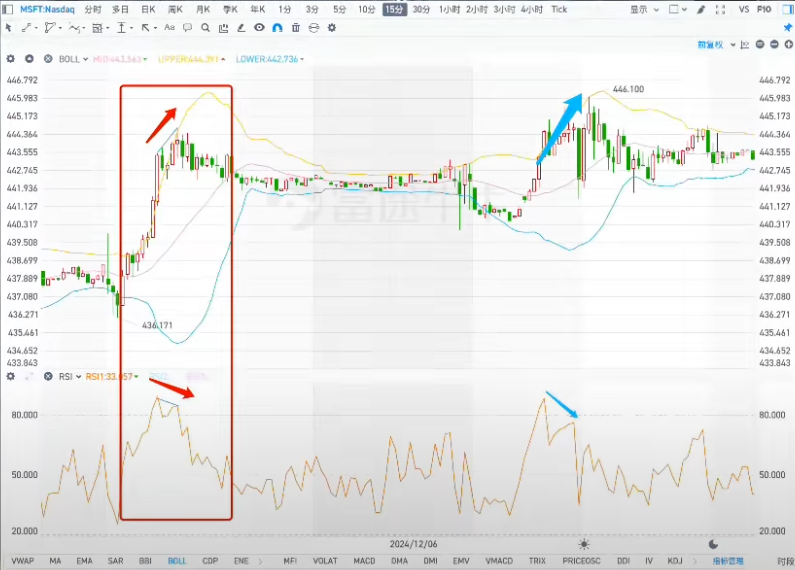
- Bearish divergence: price makes a higher high, RSI makes a lower high → momentum weakening
- Bullish divergence: price makes a lower low, RSI makes a higher low → selling exhaustion
Examples of bearish divergence:
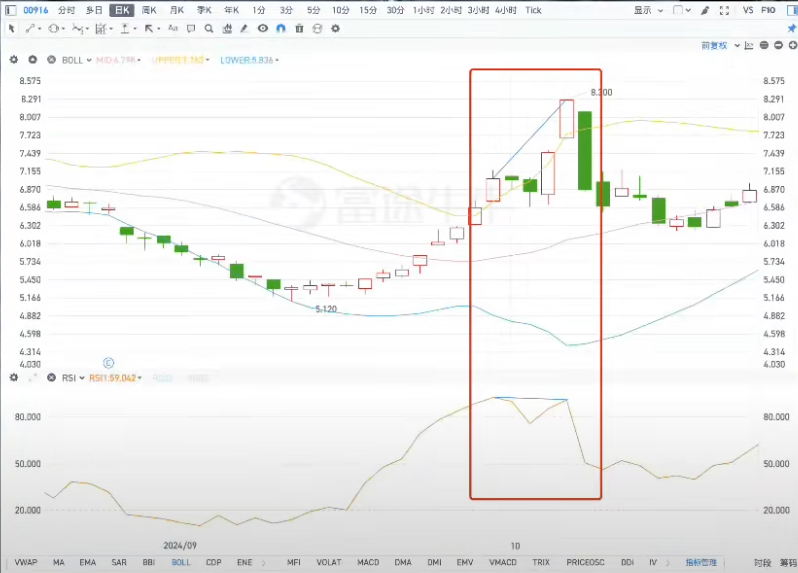
Two reminders:
① Only treat divergence as meaningful near extremes. For bearish divergence, RSI should be above 80; for bullish divergence, below 20.
② Confirm with Bollinger Bands. For example, bearish divergence + price above the upper band increases pullback probability. For bullish divergence, waiting for price to re-enter the band helps avoid catching a falling knife.
Final misconception: divergence can still fail in strong trends. In one-way downtrends (price walking the lower band), even bullish divergence may not stop the fall. Divergence becomes more useful once price exits the band channel and the one-way move is likely ending: