
Talking About the Stock Market (1) - Bollinger Bands in Practice
When I first started trading stocks in 2015, opening a tool like Tonghuashun made my head hurt: lines, bars, formulas, and endless abbreviations. For a long time I had no interest in learning where these indicators came from, because I felt they were just statistical tricks and did not help much with real trading.
Ten years later, I still do not use indicators heavily in practice, but I want to整理 the concepts and write a small "Talking About the Stock Market" series, as a memorial to my decade in markets. The probability and statistics mindset behind these indicators is worth revisiting.
1. First: What Exactly Are Bollinger Bands?
Bollinger Bands (also called Bollinger Bands) appear in almost every stock app. You see three lines: upper band, middle band, lower band.
They are not arbitrary:
- the middle band is the 20-day moving average
- the upper band is the moving average + 2 standard deviations
- the lower band is the moving average - 2 standard deviations
The statistical intuition people often reference is that price fluctuations are often treated as roughly normal around a moving average, and under that assumption, about 95% of observations fall within ±2σ. That 95% framing becomes the core premise for using the bands.
One key misconception to clarify: it is not that price moves inside the bands; the bands move with price. Many people jump straight to "touch lower band = buy" and "touch upper band = sell" and invert cause and effect.
1) Why a 20-day moving average?
20 trading days is roughly one month of trading (5 days/week × 4 weeks). It offers a reasonable short-to-mid-term view. There is no strict scientific law that it must be 20; it is more of a market convention.
2) Why 2 standard deviations, not 1 or 3?
The standard deviation choice sets band width. ±2σ is a practical balance:
- ±1σ covers ~68%, bands are too tight and generate many false signals
- ±3σ covers ~99.7%, bands are too wide and signals are rare
3) Why "95%"?
In a normal distribution, the area within ±1σ is ~68%, ±2σ ~95%, ±3σ ~99.7%. The meaning is: a band break is treated as a statistical "outlier" that may imply overextension and potential mean reversion.
2. How to Use It: Three Scenarios
1) Breakout setup: bet on a one-way move
Markets rotate between low volatility and high volatility. In Bollinger Bands:
- low vol: bands squeeze (narrow)
- high vol: bands expand (widen)
Big moves often look like: squeeze → expansion → price rides the band channel (up or down). If price gaps far above the upper band, it may be short-term overbought. Healthier moves often "walk the band" rather than flying away.
Example: Boyuan shares that I personally missed (I entered around the red circle but did not hold through the consolidation):
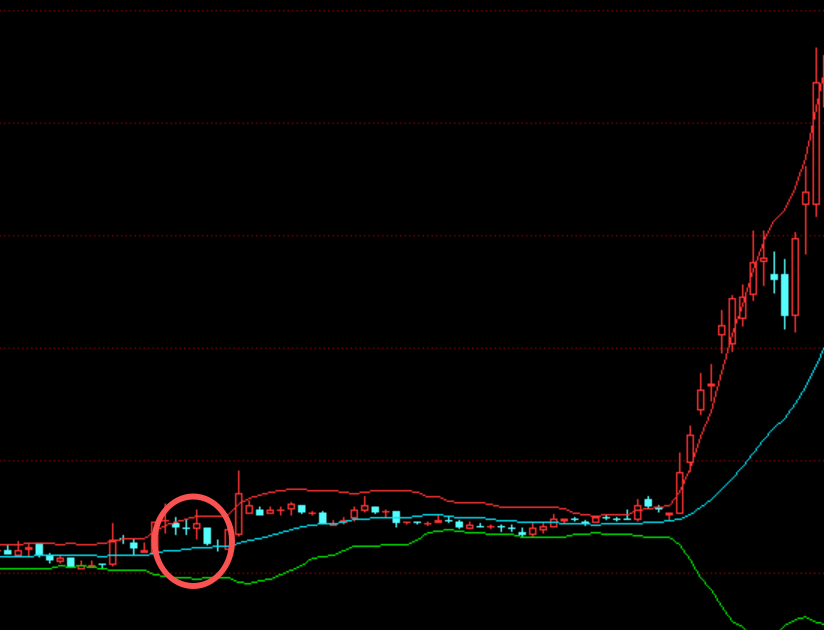
How to act? Before a big move, assets can consolidate for a long time. You need patience. In the example above, I saw signs of accumulation and wanted exposure, but it kept ranging for nearly two months. I could not endure it and left, missing the later run.
Also, form expectations: what events or catalysts could trigger the breakout—earnings, policy, or something else?
2) Range trading: mean reversion for conservative traders
Based on the "95%" idea, you can frame it as:
When price moves outside the band, it's a low-probability event that usually does not last long. That is the core logic of catching reversals.
- If price drops far below the lower band: it often snaps back into the band (assuming you still like the fundamentals).
- If price breaks far above the upper band: it often pulls back; you can consider reducing exposure.
3) Trend pullbacks: my most used approach
Many veteran traders like trend trading: pick a good asset, ride a confirmed trend. Not the extreme one-way mania, but a steadier move where the band channel slopes up (or down).
- In an uptrend, price often oscillates between the middle band and the upper band.
- In a downtrend, between the middle band and the lower band.
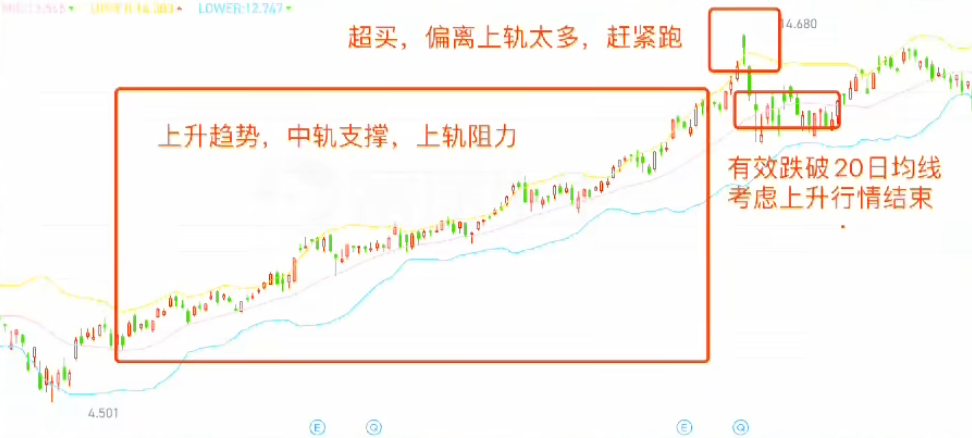
Core logic: in a strong trend, the 20-day moving average (middle band) often acts as support (uptrend) or resistance (downtrend).
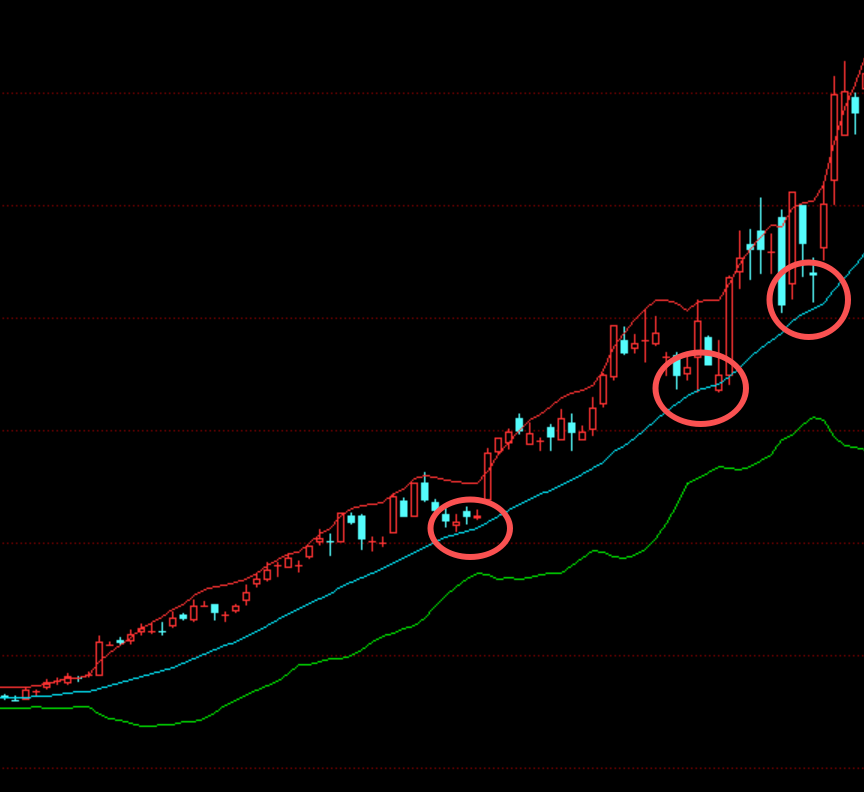
In an uptrend, you might buy nearer the lower band and reduce gradually near the middle band. In a downtrend, you might sell near the upper band and add near the middle band. The middle band is crucial: if price breaks it with a large candle, the short-term trend may be shifting and you should adjust quickly.
Example: Shenghong Tech from June to September had several good add points during its uptrend (red circles):
3. A Few Practical Notes
- Do not rely on Bollinger Bands alone. First judge the broader regime (breakout / range / trend), then use the corresponding method.
- Win rate matters more than being right every time. No indicator is 100% accurate.
- Watch exit signals: if you catch a strong run and price stays outside the upper band for multiple days, it can be an "escape" signal (overbought risk).
- Combine with other indicators (RSI, moving averages) for stronger confirmation.